How and When to Look for a Recession


Nearly a decade after the Federal Reserve’s interventions during the Great Financial Crisis, investors have been questioning whether Fed policy has corrupted the yield curve, a longtime recession indicator. Deep into this long bull market, it is tempting to rethink proven economic indicators. Looking at recent history, we find the yield curve is a helpful contextual tool – neither to be overemphasized nor to be dismissed.

Over its long-term history, the yield curve has been a strong predictor of recessions. However, over a shorter recent period, its predictive power seems underwhelming – not just for recessions, but also for stocks and high yield bonds, two important areas of focus for investors.

The Yield Curve in the Dot Com and Housing Cycles

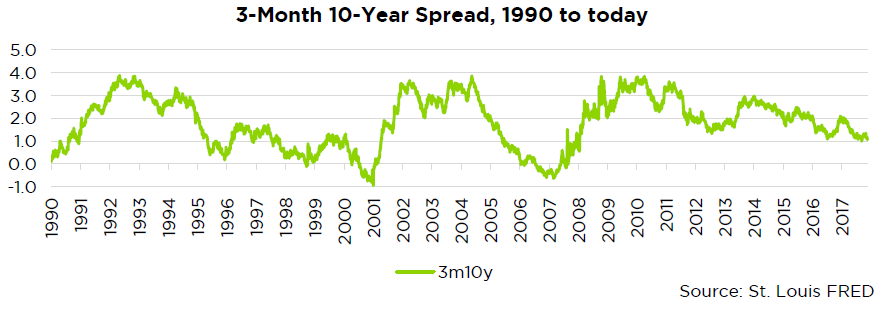
Drawing on data from 1990 to today, we examined the five most recent yield curve inversions measured by the difference between 10-year and 3-month yields. Lately, recessions have not consistently followed inversions. And twelve-month returns on the S&P 500 and high yield bonds have varied widely after each inversion.

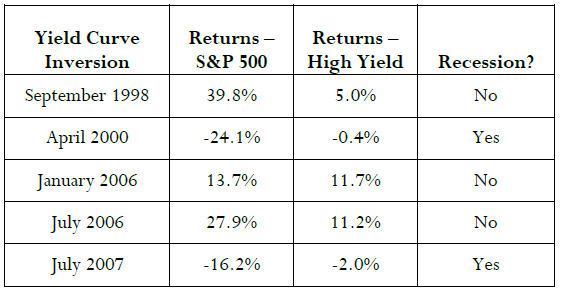
Once in 1998 and then twice in 2006, the yield curve gave seemingly false signals. In each of those cases there was still plenty of upside left in the dot-com and housing booms: No recession emerged, and stocks and high yield provided solid returns.

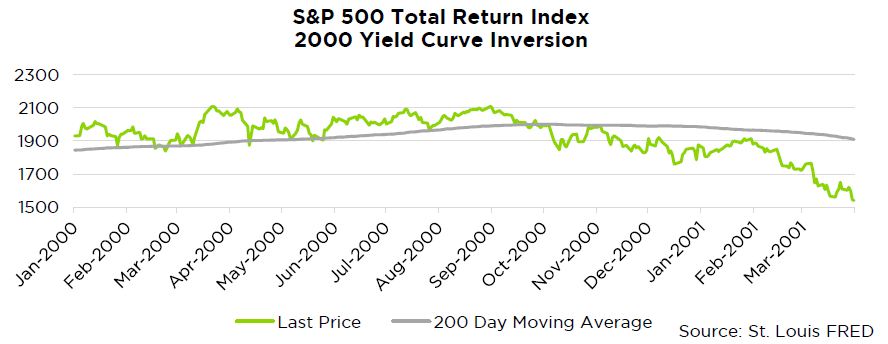
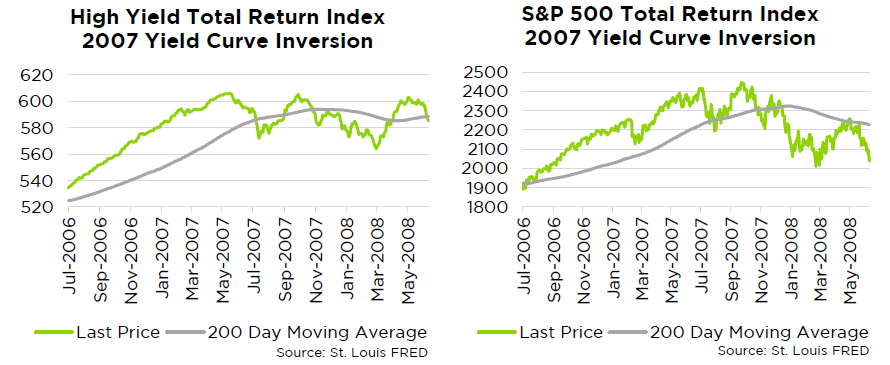
On the other hand, the 2000 and 2007 inversions preceded not only recessions but also disappointing returns in high yield and stocks.


Looking at the past 27 years, the yield curve has a mixed predictive track record. Still, owing to its robust long-term history and the two accurate positives it has lately produced, we’re not ready to abandon it entirely.

Where We Are Today

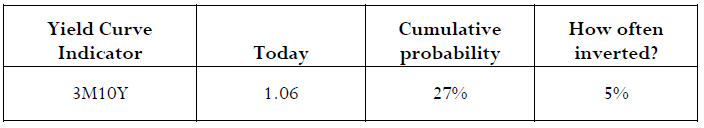
Today, the yield curve is not inverted, but it is not steep, either. Analyzing the past 27 years, we can see the yield curve has historically been flatter about 27% of the time, and steeper 73% of the time. We also see that inversions are rare, taking place about 5% of the time.

It’s not clear where the yield curve is headed next. When it’s been at today’s levels, the yield curve has followed up sometimes by steepening, sometimes by flattening, and sometimes eventually inverting.

3-Month 10-Year Spread, 1990 to Today

Abandoning the yield curve based on so-so recent performance ignores its initial intended purpose.  In their pioneering work on the yield curve, Federal Reserve bankers Arturo Estrella and Frederic Mishkin saw the yield curve as one predictive piece of the economic puzzle:

We may draw some additional conclusions. First, stock prices provide information that is not contained in the yield curve spread and which is useful in predicting future recessions. Second, a simple model containing these two variables is about the best that can be constructed from financial variables for out-of-sample prediction.

According to Estrella and Mishkin, investors should integrate the yield curve into a broader analysis. Building on that insight we believe that, rather than suddenly add or remove data points to a strategy, investors should consider their long-term convictions and make updates after careful consideration.

Notably, Estrella and Mishkin tell us stocks are also useful recession predictors. If risky investments also help to forecast economic downturns, perhaps that is a point in favor of a trend-following approach. Regardless, Counterpoint Tactical Income continues to adhere to its quantitative discipline while observing economic variables to better understand the context. Our view remains consistent with that in recent updates: Riskier assets like stocks and bonds appear expensive on many fundamental valuation measures, but such an assessment has not consistently predicted short-term drawdowns.

Footnotes

1 Estrella, Arturo, and Frederic Mishkin. 1998. “Predicting U.S. Recessions: Financial Variables as Leading Indictors.” NBER Working Paper Series.

Disclosures

The S&P 500 Total Return Index is a broad based unmanaged index of 500 stocks, which is widely recognized as representative of the US equity market in general, and includes dividend reinvestment in its value. The BofA Merrill Lynch High Yield Bond Master II® Index is an unmanaged index that tracks the performance of below investment grade U.S. denominated corporate bonds publicly issued in the U.S. domestic market. The referenced indices are shown for general market comparisons and are not meant to represent the Funds. It is not possible to invest directly in an unmanaged index.

There is no assurance the Fund Advisor’s opinions of risk management will come to pass and past performance is no assurance of future results. Of course, there is no guarantee that any investment strategy will achieve its objectives, generate profits or avoid losses. Mutual Funds involve risk including the possible loss of principal. The use of leverage by the Fund or an Underlying Fund, such as borrowing money to purchase securities or the use of derivatives, will indirectly cause the Fund to incur additional expenses and magnify the Fund’s gains or losses. Derivative instruments involve risks different from, or possibly greater than, the risks associated with investing directly in securities and other traditional investments. There is a risk that issuers and counterparties will not make payments on securities and other investments held by the Fund, resulting in losses to the Fund.

Investors should carefully consider the investment objectives, risks, charges and expenses of the funds managed by Counterpoint Mutual Funds. This and other important information about the funds are available in their prospectuses, which can be obtained at counterpointfunds.com or by calling 844-273-8637. The prospectuses should be read carefully before investing. The Counterpoint Mutual Funds fund family is distributed by Northern Lights Distributors, LLC member FINRA/SIPC. Counterpoint Mutual Funds, LLC is not affiliated with Northern Lights Distributors, LLC member FINRA/SIPC.

9020-NLD-10/24/2017

Recent Perspectives

Factor Strategies March to a Different Beat

Many investors agree: Active strategies that try to beat the stock market have periods where they perform well (contributing to outperformance) and periods where they perform poorly (contributing...

READ MORE

Mutual Funds involve risk including the possible loss of principal. Investors should carefully consider the investment objectives, risks, charges and expenses of the funds managed by Counterpoint Funds. This and other important information about the funds is available in their prospectuses, which can be obtained at counterpointfunds.com or by calling 844-273-8637. The prospectuses should be read carefully before investing. The Counterpoint Funds fund family is distributed by Northern Lights Distributors, LLC member FINRA/SIPC. To reach the Counterpoint sales team, please refer to our contact page.

5516-NLD-09/01/2021


Thank you!

We’ve received your request for the featured event collateral. A Counterpoint Funds team member will be in touch shortly.

Subscribe to stay up to date on and receive our monthly perspective.

Thank you!

We’ve received your meeting request and a Counterpoint Funds team member will be in touch shortly.

Subscribe to stay up to date on and receive our monthly perspective.

Thank you!

We’ve received your event registration request and will be in touch shortly.

Subscribe to stay up to date on Counterpoint Funds and receive our monthly perspective.

Thank you!

We have received your application and look forward to reviewing your qualifications for the role. If your application seems like a good fit, we will contact you to discuss next steps.

Thank you again for your application and interest in joining the Counterpoint team!

Thank you!

We’ve received your message. A Counterpoint Funds team member will contact you soon.

Subscribe to stay up to date and receive our monthly perspective.