Where Did All the Alpha Go?


We all know the 2008 financial crisis completely upended Wall Street. Storied firms disappeared; Dodd Frank ushered in a new regulatory regime; and central bankers unveiled unprecedented monetary policies.

Along with those tangible shifts, powerful narratives have emerged in our post-crisis world: hedge funds are struggling; indexing is more popular than ever; stock picking is a dying art.

We at Counterpoint believe we’ve found a key driver of these new stories: Stocks with characteristics (also known as factors or anomalies) that historically have led to outperformance seem to have lost their edge since the market lows of 2009. Equity portfolio managers really have been operating in a new environment for the past eight years – you can see it in the data.

We looked at the top and bottom deciles of US stocks based on their exposures to a set of five well-studied anomalies. In the years leading up to the crisis, the best stocks according to these measures outperformed. But in the post-crisis era, a long-only portfolio of top-decile anomaly stocks with apparently favorable factor exposures would have slightly underperformed the S&P 500. Below are averages of relative returns to the S&P 500 over different time frames of the top decile of stocks within a few different factors.


Figure 1a: Average Monthly Top Decile Anomaly/Factor Returns Relative to the S&P 500

The illustrations above and below are shown for informational purposes only and are not reflective of any actual investment results nor do they represent fund performance.  Investors cannot invest directly in a factor and unmanaged factor returns do not reflect any fees, expenses or sales charges. Past performance is no guarantee of future results.

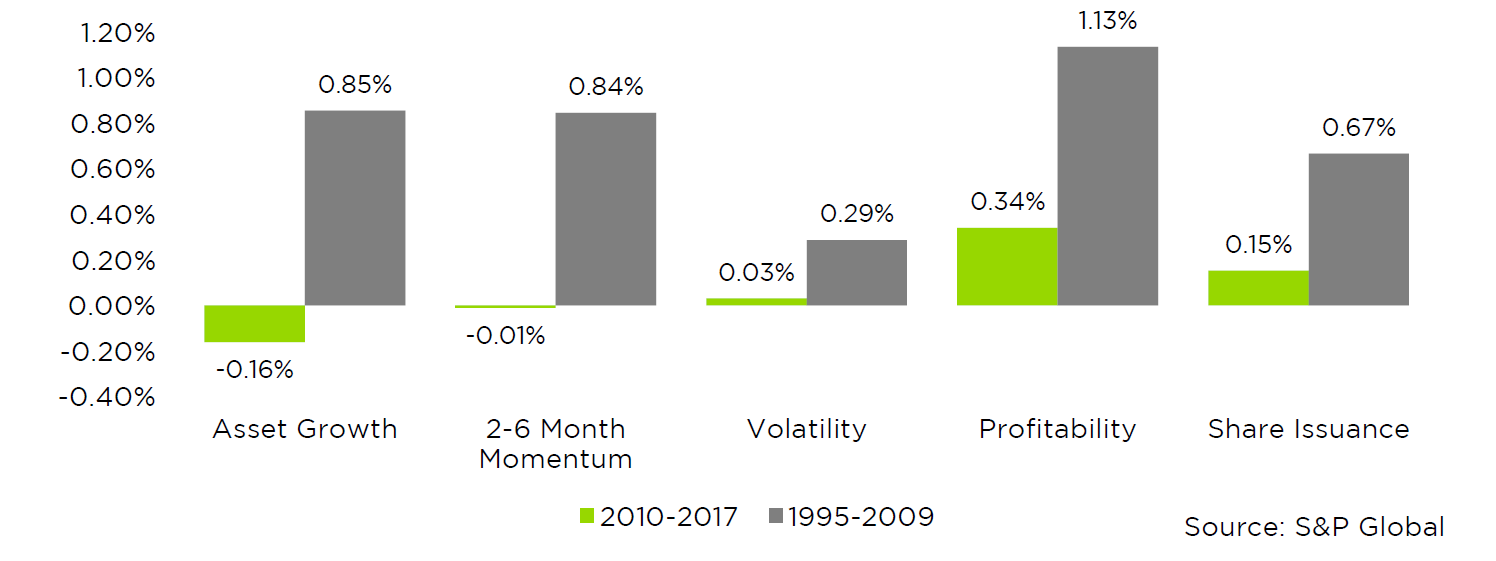
During the post-crisis period, assets have flowed into long-only “smart beta” strategies that aim to capture factor-based performance. We believe the two events are related. Flows into smart beta have pushed up prices of stocks with attractive factor exposures, impairing subsequent returns.

In light of this grim performance, some may wonder whether factor-based strategies have completely lost their edge. Some may further wonder whether Counterpoint jumped into a crowded environment, with little chance of delivering alpha. Our response on both counts: Not quite.


Figure 1b: Average Monthly Bottom Decile Anomaly/Factor Returns Relative to the S&P 500

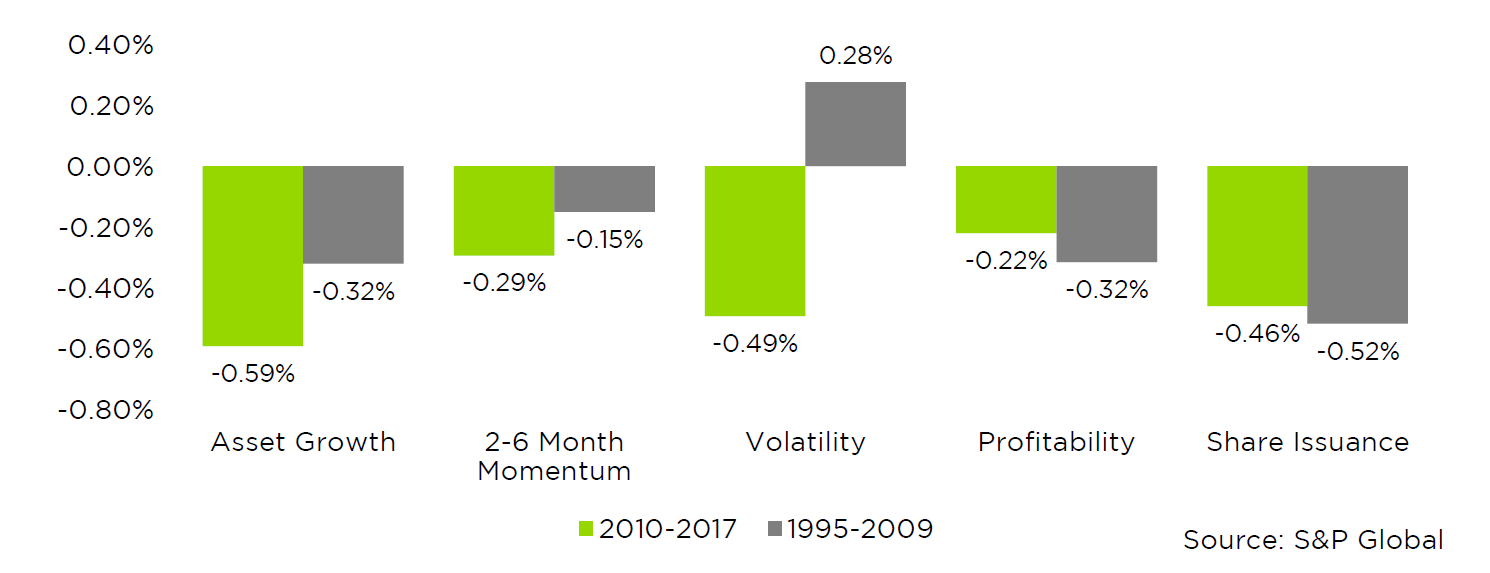
As seen above in Figure 1B, alpha was still available (and actually improved for some factors) to strategies that sold short stocks with the worst factor-based profiles. Companies with bloating asset bases, downward trending or volatile share prices, poor profitability, and a tendency to issue shares continue to do poorly.


Figure 2: Average Monthly Long-Short Anomaly/Factor Returns

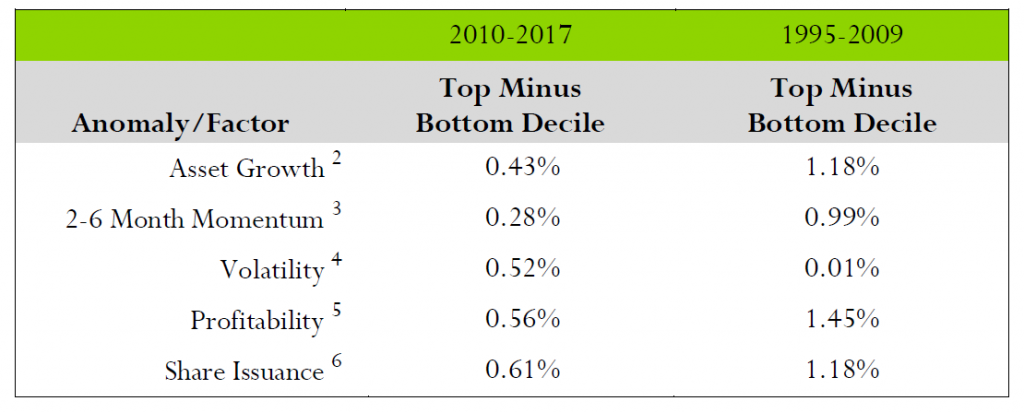
Pictured above, long-short and market-neutral strategies that go long the top decile of stocks with good qualities, and short the opposing decile of stocks have had access to alpha1 across both pre- and post-financial crisis time frames.What’s going on here? A few thoughts:

First, increased awareness of academic research may have led to strategy crowding, eliminating many factor-based long-only opportunities. If this is the case – and if recent history is a guide – investors shouldn’t expect too much from long-only smart beta strategies that have lately come into vogue. The excess returns available to such strategies during the past eight years, not factoring in transaction costs, appear as the green bars in Figure 1A above. Not great.

Second, logistical challenges and investors’ traditional distaste for short sellers and short selling may have preserved opportunities on the short side. In fact, long-short and market-neutral strategies may be “the best of what’s left” for investors seeking factor-based outperformance.

Interestingly, investing indiscriminately in any long-short strategy guarantees little. Evidence shows discretionary professional money managers on average invest in a manner opposite to the correct anomaly exposure. What remains is the sweet spot for opportunity in factor-driven (particularly multi-factor) long-short strategies.

Finally, readers should note that this analysis relates only to US stocks. Global factor-based strategies present a different set of opportunities.  The data shows market efficiency and crowding within factor strategies is lower outside the US. We plan to discuss that subject in an upcoming piece.

Notes and Disclosures

1 The volatility anomaly’s flip from negative to positive average monthly long-short performance deserves a separate discussion.  Investors were rewarded substantially in the 90s tech bubble for adding volatility to their portfolios. This is an outlier; over the long-term investors have typically been punished for owning more volatile stocks. Second, the volatility anomaly’s performance shows a connection to interest rate movements.  Falling interest rate environments typically benefit quality high-dividend stocks, which tend to have low volatility.  From 2009 to 2016, global interest rates fell to multi-century or all-time lows, creating an unusually friendly environment for low volatility stocks.

2 Asset Growth is defined as the annual percentage change in book value of assets in the prior fiscal year. (Source paper)

3 2-6 Month Momentum is defined as the total return for a given stock from 6 months prior to 2 months prior. The most recent month is excluded as it typically exhibits mean-reversion effects. (Source paper)

4 Volatility is defined as the trailing 12 month standard deviation. (Source paper)

5 Profitability is defined as the ratio of a firm’s gross profits (revenues minus cost of goods sold) to its assets. (Source paper)

6 Share issuance is defined as the annual percentage of new shares issued over the prior fiscal year. (Source paper)

For all anomalies/factors, top decile represents the top 10% of stocks within the sorted universe that exhibit the “good” side of the result. The bottom decile represents the bottom 10% within the same universe that exhibits the “bad” side. For example, in Asset Growth, stocks with high growth of assets historically delivered lower average returns, so our top decile represents the stocks with the lowest asset growth.

All return data is sourced from S&P Global. The stock universe is US stocks with a price above $3. No transaction costs are included. Factor returns are generated from monthly-rebalanced portfolios based on factor ranks known from the prior month. The performance data does not represent that of Counterpoint’s strategies. Counterpoint’s strategies do not invest in single-factor long-short anomalies; they instead use a multi-factor approach to enhance positioning.

There is no assurance the Fund Advisor’s opinions of risk management will come to pass and past performance is no assurance of future results. Of course, there is no guarantee that any investment strategy will achieve its objectives, generate profits or avoid losses.

Investors should carefully consider the investment objectives, risks, charges and expenses of the funds managed by Counterpoint Mutual Funds. This and other important information about the funds are available in their prospectuses, which can be obtained at counterpointfunds.com or by calling 844-273-8637. The prospectuses should be read carefully before investing. The Counterpoint Mutual Funds fund family is distributed by Northern Lights Distributors, LLC member FINRA/SIPC. Counterpoint Mutual Funds, LLC is not affiliated with Northern Lights Distributors, LLC member FINRA/SIPC.

4494-NLD-4/23/2018

Recent Perspectives

Factor Strategies March to a Different Beat

Many investors agree: Active strategies that try to beat the stock market have periods where they perform well (contributing to outperformance) and periods where they perform poorly (contributing...

READ MORE

Mutual Funds involve risk including the possible loss of principal. Investors should carefully consider the investment objectives, risks, charges and expenses of the funds managed by Counterpoint Funds. This and other important information about the funds is available in their prospectuses, which can be obtained at counterpointfunds.com or by calling 844-273-8637. The prospectuses should be read carefully before investing. The Counterpoint Funds fund family is distributed by Northern Lights Distributors, LLC member FINRA/SIPC. To reach the Counterpoint sales team, please refer to our contact page.

5516-NLD-09/01/2021


Thank you!

We’ve received your request for the featured event collateral. A Counterpoint Funds team member will be in touch shortly.

Subscribe to stay up to date on and receive our monthly perspective.

Thank you!

We’ve received your meeting request and a Counterpoint Funds team member will be in touch shortly.

Subscribe to stay up to date on and receive our monthly perspective.

Thank you!

We’ve received your event registration request and will be in touch shortly.

Subscribe to stay up to date on Counterpoint Funds and receive our monthly perspective.

Thank you!

We have received your application and look forward to reviewing your qualifications for the role. If your application seems like a good fit, we will contact you to discuss next steps.

Thank you again for your application and interest in joining the Counterpoint team!

Thank you!

We’ve received your message. A Counterpoint Funds team member will contact you soon.

Subscribe to stay up to date and receive our monthly perspective.